Black carbon concentrations
Globally, the highest black carbon concentrations in the present-day atmosphere are simulated over south-eastern China and India (Fig.1). Concentrations are also high over large areas in Africa and South-America during the seasons with active biomass burning in tropical forests and savannas. In Europe and most of North America, black carbon surface air concentrations are highest during the winter period as a result of more active wood burning and less efficient vertical mixing of surface emissions during that time of the year.
Black carbon burden follows roughly the same spatial pattern as the black carbon surface air concentration, except that the burden tends to spread over somewhat larger areas around the major source areas in Asia, central Africa and southern America (Fig. 1).
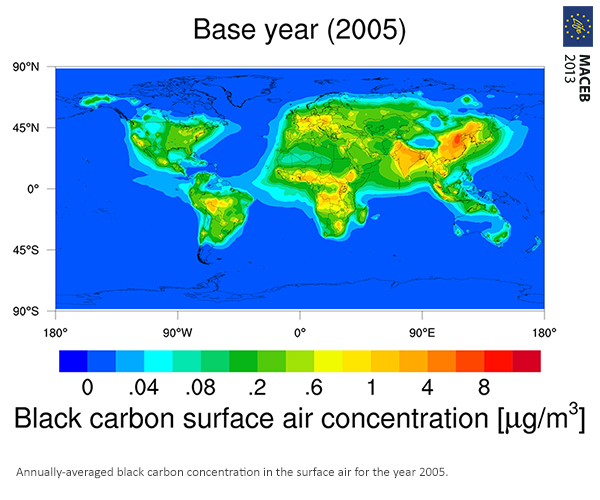
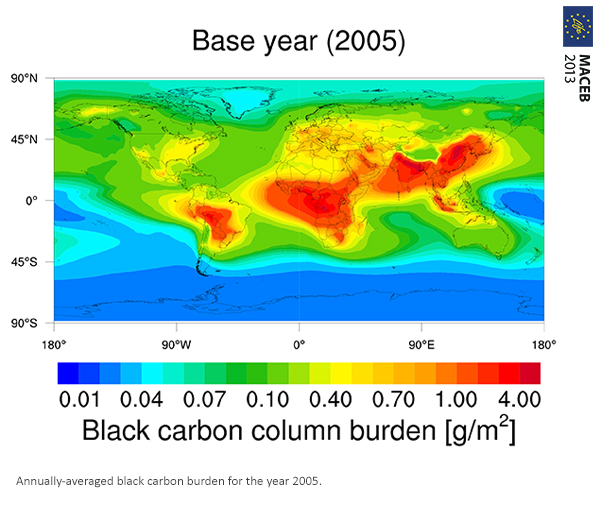
Fig. 1 Annually-averaged black carbon concentration in the surface air (left) and black carbon burden (right) for the year 2005. (Click the map to enlarge)
When averaged over one year, both black carbon surface air concentration and burden show a large South-to-North decrease between the latitudes of about 50 and 70 N over the continental areas in Europe, Asia and North-America. Typical black carbon burdens over the Arctic are 2 to 3 orders of magnitude lower than those encountered over the polluted areas in Asia, central Africa and southern America, and more than a factor lower than those encountered in central Europe.
Contribution of European and Finnish emissions
In terms of the surface air concentration, a vast majority of black carbon in central and western Europe and a significant fraction of it in the European Arctic can be ascribed to emissions from the EU-27 countries (Fig. 2). Elsewhere, the contribution of European emissions seems to be minor or negligible. In terms of black carbon burden, emissions from the EU-27 countries extend a bit further, being visible over northern Africa and over eastern parts of Europe.
Finnish emissions have significant influence on black carbon surface air concentrations over most of the southern Finland (Fig. 2). Outside Finland, the contribution of Finnish emission to black carbon surface air concentrations is minor, and to the black carbon burden in practice negligible.
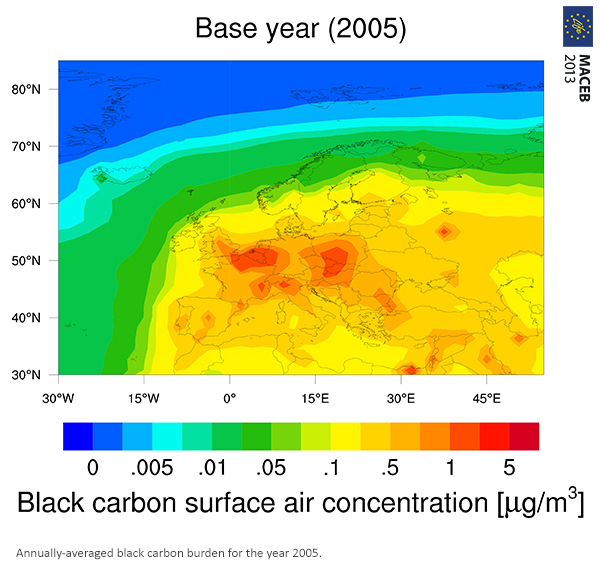
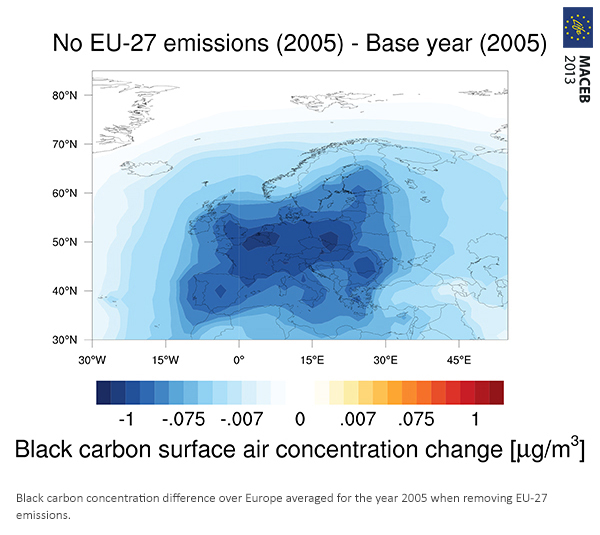
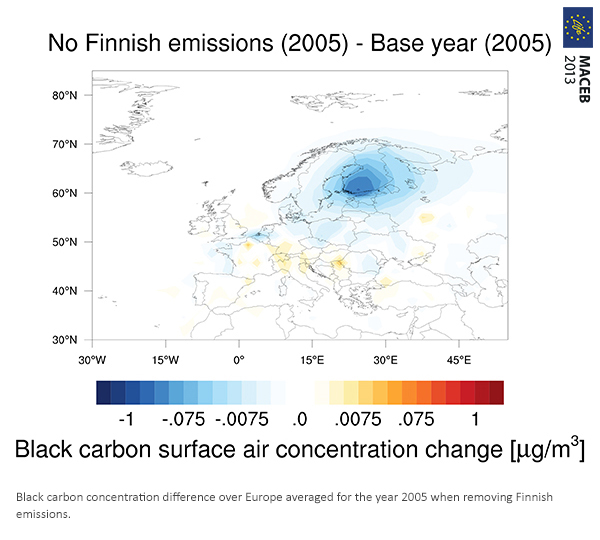
Fig. 2. Black carbon concentrations in the surface air over Europe averaged for the year 2005 (left), the corresponding concentration difference when removing EU-27 emissions (middle) and Finnish emissions altogether (right). (Click the map to enlarge)
Future changes in concentrations and burdens
Future changes in aerosol surface air concentrations and burdens depend strongly on the assumed emission scenario. It seems that future changes in black carbon burdens will be smoother, and extend over larger areas, than corresponding changes in black carbon surface air concentrations.
In case of the reference scenario with current air pollution policies and legislation (CLEC) and the scenario with green house gas oriented climate measures (CLECC), black carbon concentrations are predicted to decrease over most parts of Europe, North America and China by 2020 and 2030, whereas substantial concentrations increases are predicted over India and large areas in Africa. In case of the mitigation scenarios MTFR and BCadd, black carbon will decrease almost everywhere in the world (Fig 3).
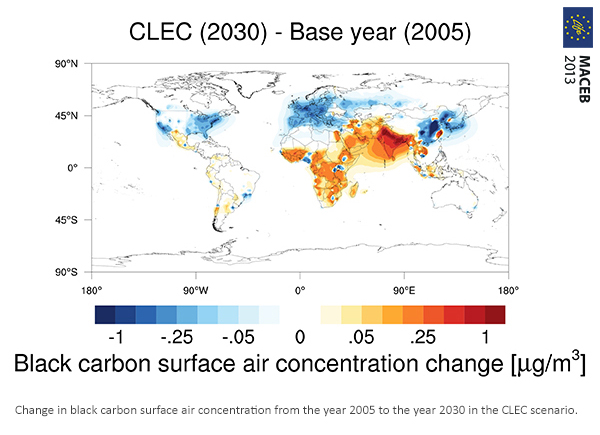
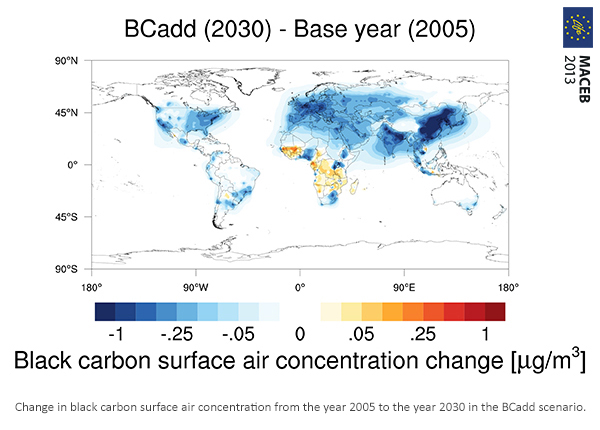
Fig 3. Change in black carbon surface air concentration from the year 2005 to the year 2030 in the scenarios CLEC (left) and BCadd (right). (Click the map to enlarge)
Surface air concentrations of organic carbon are predicted to change geographically in a similar way as black carbon in the near future. The main difference is that no (very few) region in the world will show an increase in the organic carbon concentration when assuming either of the mitigation scenarios (MTFR or BCadd).
Surface air concentrations of sulfate are predicted to decrease everywhere in the mitigation scenario MTFR, and everywhere except over and downwind India in the reference scenarios CLEC and CLECC and in the other mitigation scenario BCadd.