Emissions by region
Emissions of black carbon, organic carbon and sulfur dioxide (SO2) affecting climate warming differ by world region depending on the level of economic activity and technological development.
Individual countries contributing most to the global total emissions are China and India (Fig 1, 2 and 3). According to the estimations China has a slight declining trend in emissions until 2030, whereas Indian emissions of organic carbon are projected to stay approximately on the same level as in 2005 while the emissions of black carbon and sulfur dioxide (SO2) are estimated to increase.
Asia accounts altogether for about 60 percent of global emissions of black carbon and organic carbon and 70 percent of SO2. African emissions contributed around 20 percent of black carbon and organic carbon emissions in 2005 and are estimated to increase to around 25 to 30 percent in 2030. European and Northern American emissions comprise 10 to 15 percent of the global total for black carbon and organic carbon in 2005, but are going to decrease to less than 10 percent in 2020 and remain on that level in 2030.
The EU27 and North America have approximately equal emission shares of black carbon and organic carbon, but in case of SO2 North American emissions are higher. The United States accounts for most of the North American emissions.
Climate measure impacts in different regions
According to scenarios used in the MACEB project the changes in the total amount of emissions differ from one region to another. From 2005 to 2030 the emissions decline most in the EU-27, North America and China but the trend in those regions is partially offset by projected emission increases in Africa, India and Other Asia.
The net emission decrease is more pronounced in the scenario with greenhouse gas oriented climate measures (CLECC) compared with the current air pollution policies and legislation scenario (CLEC). The CLECC introduces more moderate regional emission increases in combination with more emphasized emission reductions and results in higher reductions in global emissions compared with CLEC (Fig 4 and 5).
Emission mitigation possibilities in different regions
Figures 6 and 7 show the regional emission changes for the mitigation scenarios BCadd and MTFR in 2030 relative to the base year 2005 emissions. In the BCadd scenario the emissions decline in all regions apart for Indian SO2 emissions that increase. Largest emission reductions take place in China and India, but in case of SO2 also Northern America and the EU27 account for a major share of the decline. As expected the MTFR scenario introduces larger reductions of SO2 emissions compared with the BCadd scenario due to the nature of the scenario. The BCadd scenario was designed to achieve large reductions in radiative forcing at the global scale, whereas the MTFR scenario implements the maximum reduction potential of aerosol and SO2 emissions with currently available technologies.
Emission figures
Click the figures to enlarge
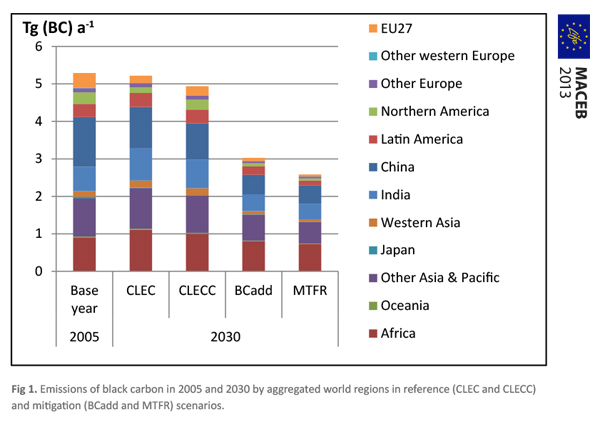
Fig 1. Emissions of black carbon in 2005 and 2030 by aggregated world regions in reference (CLEC and CLECC) and mitigation (BCadd and MTFR) scenarios.

Fig 2. Emissions of organic carbon in 2005 and 2030 by aggregated world regions in reference (CLEC and CLECC) and mitigation (BCadd and MTFR) scenarios.
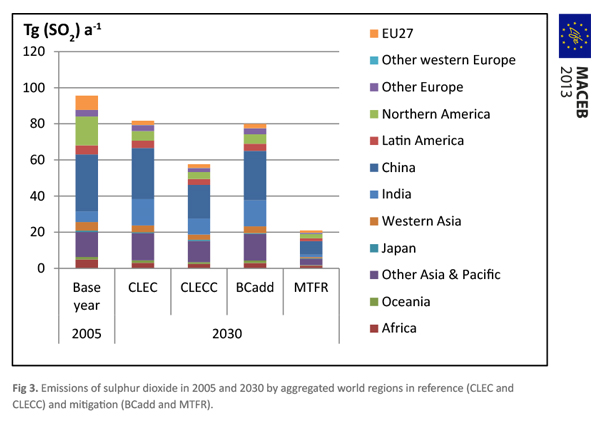
Fig 3. Emissions of sulphur dioxide in 2005 and 2030 by aggregated world regions in reference (CLEC and CLECC) and mitigation (BCadd and MTFR).
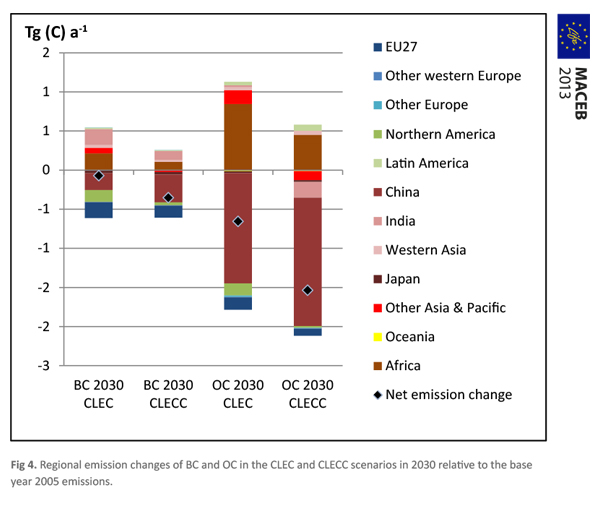
Fig 4. Regional emission changes of BC and OC in the CLEC and CLECC scenarios in 2030 relative to the base year 2005 emissions.
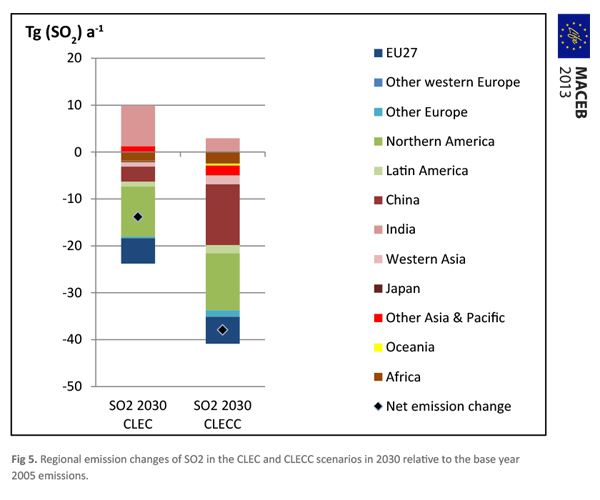
Fig 5. Regional emission changes of SO2 in the CLEC and CLECC scenarios in 2030 relative to the base year 2005 emissions.
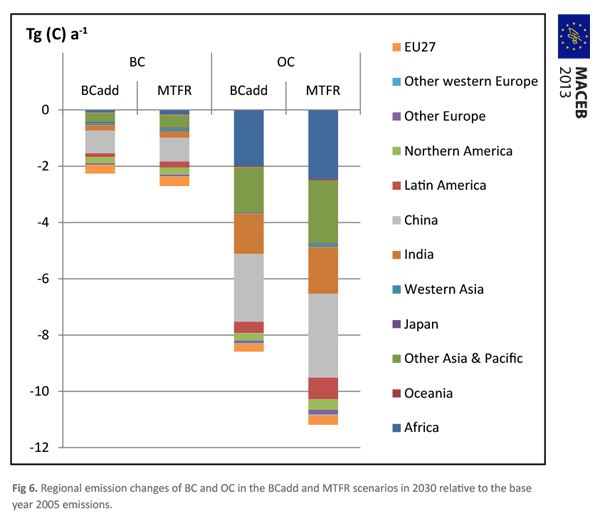
Fig 6. Regional emission changes of BC and OC in the BCadd and MTFR scenarios in 2030 relative to the base year 2005 emissions.
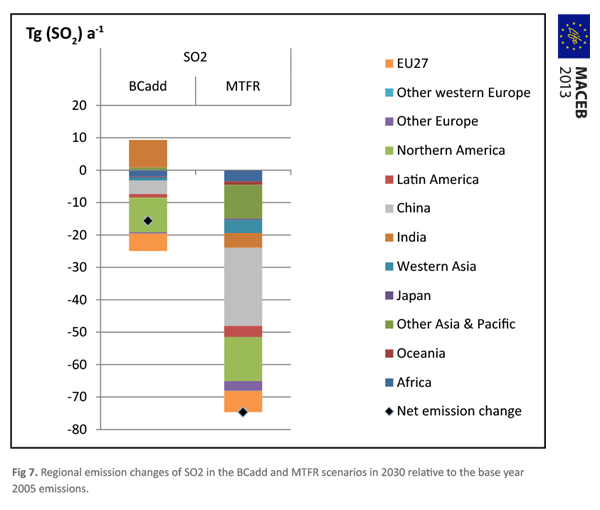
Fig 7. Regional emission changes of SO2 in the BCadd and MTFR scenarios in 2030 relative to the base year 2005 emissions.