
Emissions by sector
Different economic sectors contribute variably to different emission components. In case of black carbon (BC) and organic carbon (OC) (Fig. 1 and 2) the three key sectors throughout the study period in the reference scenarios are Residential and commercial combustion, Transport and Agricultural waste burning. The emissions from the Waste treatment and disposal sector come mostly from flaring in the oil and gas fields. Whereas the two major emitting sectors of sulfur dioxide (SO2) (Fig. 3) are Industrial combustion and processes as well as Energy production and distribution, which were of relatively minor significance in case of black carbon and organic carbon.
Sector emissions in reference scenarios
The sector specific emission changes in 2030 due to the reference scenario with greenhouse gas oriented climate measures (CLECC) relative to the current air pollution policies and legislation scenario (CLEC) are shown in Fig. 4.The results indicate that Residential and commercial combustion and Transport sectors are responsible for the reductions in black carbon and organic carbon, but Energy production and distribution, Industrial combustion and processes as well as Residential and commercial combustion account for the SO2 reductions. The CO2 reduction measures included in the CLECC scenario but not in CLEC result in major reductions in SO2, but do not in relative terms affect as much black carbon and organic carbon.
Sector emissions in mitigation scenarios
The emission differences between BCadd and the CLEC scenarios demonstrate that it is possible to design a mitigation scenario that focuses on the most important emission sectors, specifically the Residential and commercial combustion and Transport, and implements existing, in-use technologies that do not reduce the cooling SO2 emissions. The emission differences between the BCadd and the CLEC scenarios in 2030 (Fig. 5) shows that compared with CLEC, the BCadd scenario reduces the emissions of BC by 42 percent and OC by 61 percent, but has insignificant effect on SO2 emissions.
The fact that the measures reducing BC always reduce the emissions of OC as well, as shown in Fig. 5, was taken into account already while choosing the set of mitigation measures to be included into the scenario by studying the radiative balance of emission factors of multiple pollutants (for more information see UNEP/WMO, 2011). Because BC is estimated to have a much stronger forcing potential than OC, the emission reduction in OC in the BCadd scenario does not offset the forcing benefit achieved with the BC emission reduction.
Figure 6 shows the emission differences between the MTFR and the CLEC scenarios in 2030. The MTFR scenario is a scenario that implements the best available reduction technologies of aerosol and SO2 emissions currently available to demonstrate the theoretical maximum reduction potential that could be achieved.
Spatial distribution of sectoral emissions
The emissions of black carbon from different emission source sectors have strongly different spatial distribution. Surface transportation emissions are mainly concentrated on urbanized areas in Europe, North America and Asia (Fig 7). For residential combustion, considerable emissions take place also in Europe and North America, but, in contrast to the transportation emissions, highest emission densities occur in India, south-eastern China and sub-Saharan Africa (Fig 8). Agricultural waste burning emissions take place mainly in south-eastern Asia (Fig 9).
Emission source sector definitions
| Emission source sector | Definition |
|---|---|
| Energy production and distribution | Energy production and distribution sector includes emissions from combustion processes in power plants and generators as well as emission related to distribution of energy to consumers. |
| Industrial combustion and processes | Industrial combustion and processes sector includes emissions from combustion happening in industrial boilers as well as emissions from industrial production processes. |
| Residential and commercial combustion | Residential and commercial sector includes emissions from combustion in heating and cooking stoves and boilers in households and public and commercial buildings like malls, hospitals and schools. |
| Transport | Transport sector includes emissions from all land based transport of goods, animals and persons on road networks as well as off-road activities e.g. on railroads, agricultural and forest lands, construction sites. Shipping in in-land waters and domestic aviation are also included in this sector, but international shipping and aviation are treated as separate sectors. |
| Waste treatment and disposal | Waste treatment and disposal sector includes emissions from waste incineration and the treatment process. |
Emission figures
Click the figures to enlarge
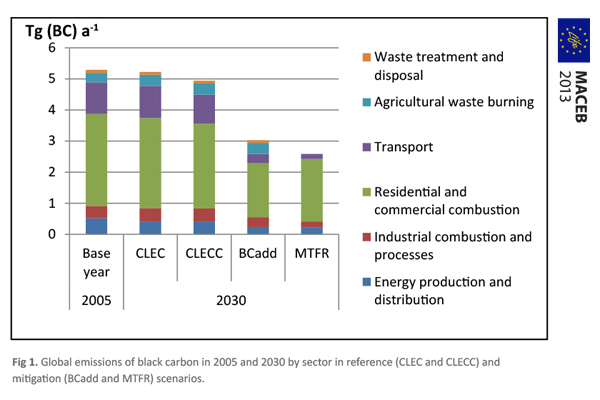
Fig 1. Global emissions of black carbon in 2005 and 2030 by sector in reference (CLEC and CLECC) and mitigation (BCadd and MTFR) scenarios.
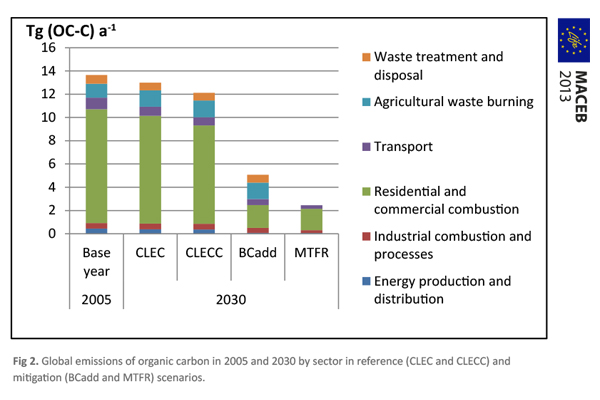
Fig 2. Global emissions of organic carbon in 2005 and 2030 by sector in reference (CLEC and CLECC) and mitigation (BCadd and MTFR) scenarios
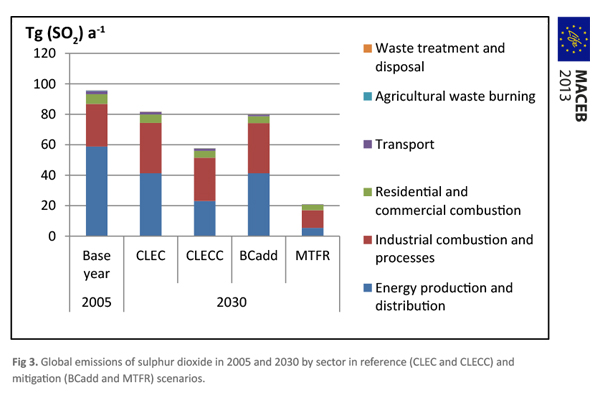
Fig 3. Global emissions of sulphur dioxide in 2005 and 2030 by sector in reference (CLEC and CLECC) and mitigation (BCadd and MTFR) scenarios.

Fig 4. Differences (%) of CLECC scenario emissions by sector compared with the CLEC scenario in 2030.
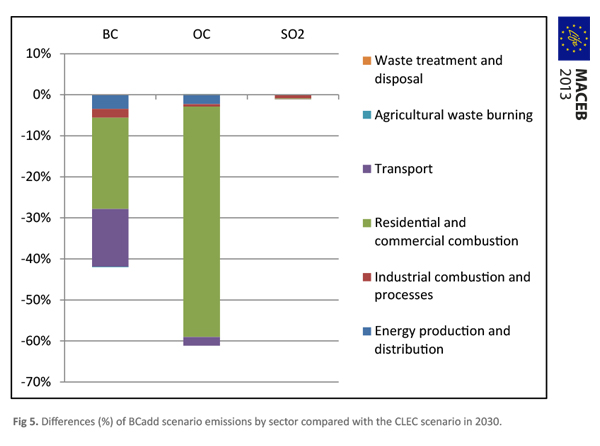
Fig 5. Differences (%) of BCadd scenario emissions by sector compared with the CLEC scenario in 2030.
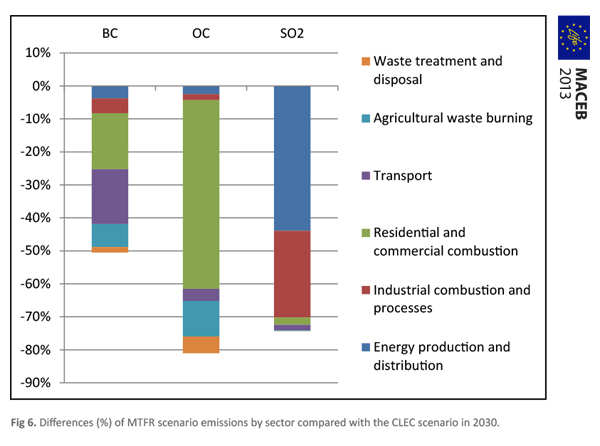
Fig 6. Differences (%) of MTFR scenario emissions by sector compared with the CLEC scenario in 2030.
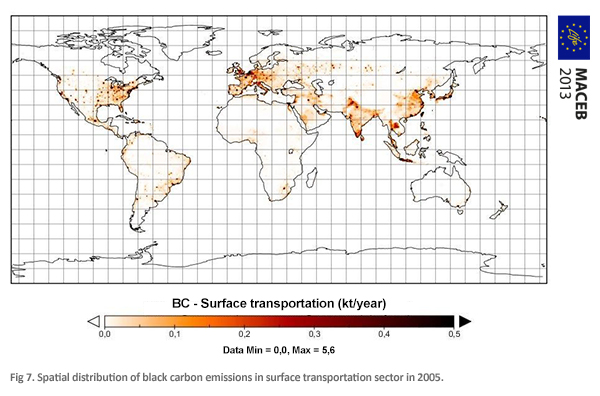
Fig 7. Spatial distribution of black carbon emissions in surface transportation sector in 2005.
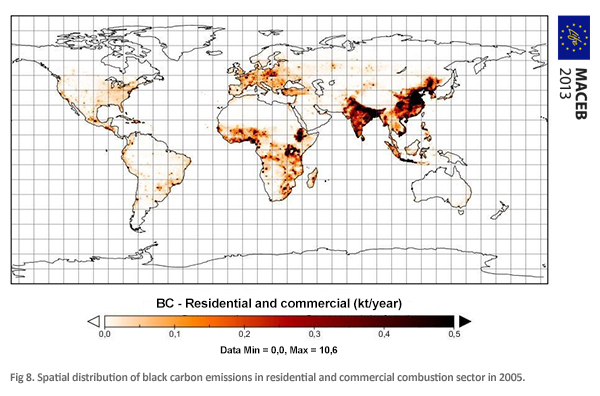
Fig 8. Spatial distribution of black carbon emissions in residential and commercial combustion sector in 2005.
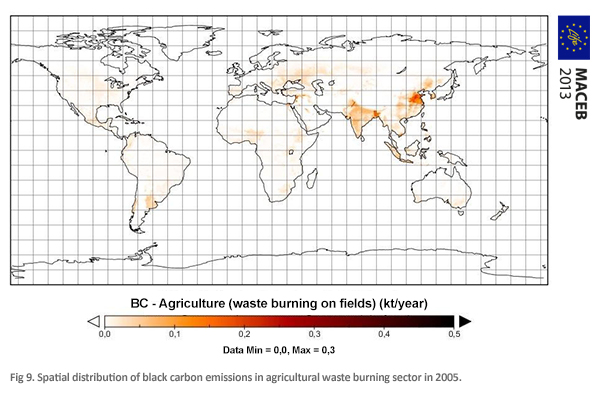
Fig 9. Spatial distribution of black carbon emissions in agricultural waste burning sector in 2005.