Emissions by scenario
The MACEB project applies four global scenarios to demonstrate black carbon, organic carbon and sulfur dioxide emissions and to study the responses in the Arctic climate. The scenarios describe future pathways of emissions following the assumptions about the size of the population, energy use, food production etc. The scenarios cover the years 2020 and 2030, as well as the base year 2005.
The assumptions about the level of implementation of climate measures and air pollution emission mitigation in the future are represented in the scenarios. These scenarios have impact on the development of the emissions of black carbon, organic carbon and sulfur dioxide (SO2).
Emission changes 2005 to 2030
Current air pollution policies and legislation scenario (CLEC) is estimated to achieve only moderate reductions of 0.5 to 5 percent in emissions of black carbon and organic carbon by 2020 and 2030 (Fig. 1 and 2). However, for sulfur dioxide (SO2) emissions a reduction of about 15 percent is expected by 2020 and 2030 due to the measures mainly in Energy production and distribution sector (Fig. 3, see also Emissions by sector).
The impact of climate measures
The scenario that assumes carbon dioxide (CO2) reduction oriented climate measures in addition to the air pollution policies (CLECC) would result in 7, 11 and 40 percent reductions in black carbon (BC), organic carbon (OC) and SO2, respectively by 2030 compared with the base year 2005 situation, i.e. the climate measures targeted to the reductions of CO2 lead to the reduction of BC, OC and SO2 emissions
Emissions mitigation possibilities
The mitigation scenarios (BCadd and MTFR) reduce the emissions of BC and OC significantly. Compared with the situation in 2005, the BCadd scenario reduces the emissions of BC by 42 percent and OC by 61 percent, but has insignificant effect on SO2 emissions. The reductions of BC and OC target the most important sectors, specifically the Residential and commercial combustion and Transport. The MTFR scenario reduces significantly also the emissions of SO2, in addition to BC and OC, achieving reductions of 51, 82 and 78 percent for BC, OC and SO2, respectively.
Scenario descriptions
Emission figures
Click the figures to enlarge
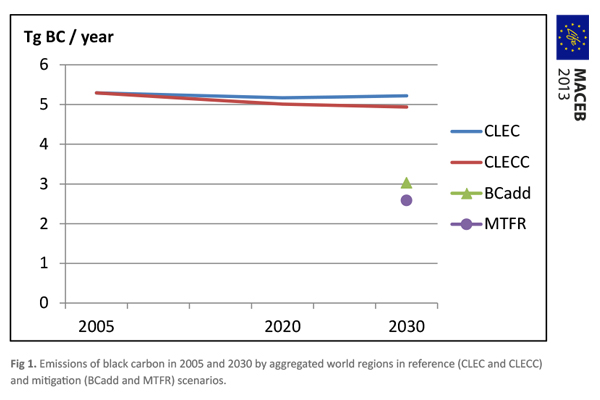
Fig 1. Emissions of black carbon in 2005 and 2030 by aggregated world regions in reference (CLEC and CLECC) and mitigation (BCadd and MTFR) scenarios
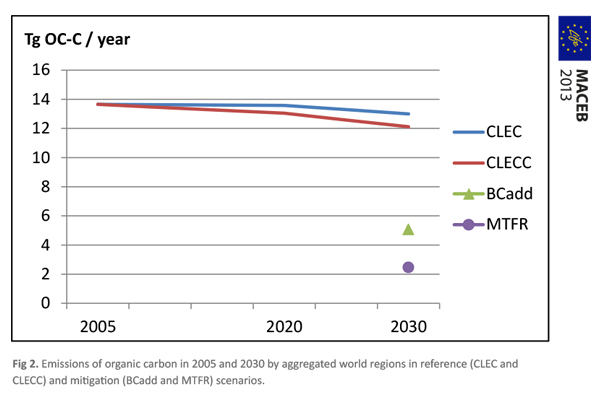
Fig 2. Emissions of organic carbon in 2005 and 2030 by aggregated world regions in reference (CLEC and CLECC) and mitigation (BCadd and MTFR) scenarios

Fig 3. Emissions of sulphur dioxide in 2005 and 2030 by aggregated world regions in reference (CLEC and CLECC) and mitigation (BCadd and MTFR)